Muskogee Muskogee
County Seat > Muskogee
Population Overview - 2014
Indicator County State
Population
1
69,966 3,878,051
Number of live births
2
929 53,286
Birth rate (live births per 1000 people)
1,2
13.3 13.7
Percent of births by maternal race/ethnicity
2
· Non-Hispanic White 50.4% 59.5%
· Non-Hispanic Black 11.8% 8.2%
· Hispanic 5.8% 13.7%
· Non-Hispanic American Indian 24.1% 9.5%
· Non-Hispanic Asian *** 2.9%
· Other and multiple race 7.4% 6.3%
Five Year Overview for the Period 2010-2014
Indicator County State
Infant mortality < 1 year
· Average infant mortality
rate (per 1000 live births)
2
6.7 7.5
Number of infant deaths
2
32 1,979
Birth weight
· Low birth weight
2
8.4% 8.0%
· Very low birth weight
2
1.3% 1.3%
Preterm births
· Preterm
2
13.1% 13.2%
· Early term/late preterm
2
26.7% 28.0%
Prenatal care during 1st trimester
2
65.6% 67.5%
Teen birth rate (per 1000 female
population aged 15-19 years)
2,5
56.7 45.4
Socioeconomic Status Overview
Indicator County State
Maternal education
2010-
< high school
2
2014 23.2% 19.9%
Insurance status
· Uninsured < 18 years
3
2013 12.6% 10.6%
· Uninsured females 18-64
3
2013 27.6% 23.6%
Median household income
4
2014 $41,015 $47,524
Familes with children aged
0-17 years below the
federal poverty level
4
2014 30.9% 22.4%
*** : calculations suppressed due to cell size less than 5
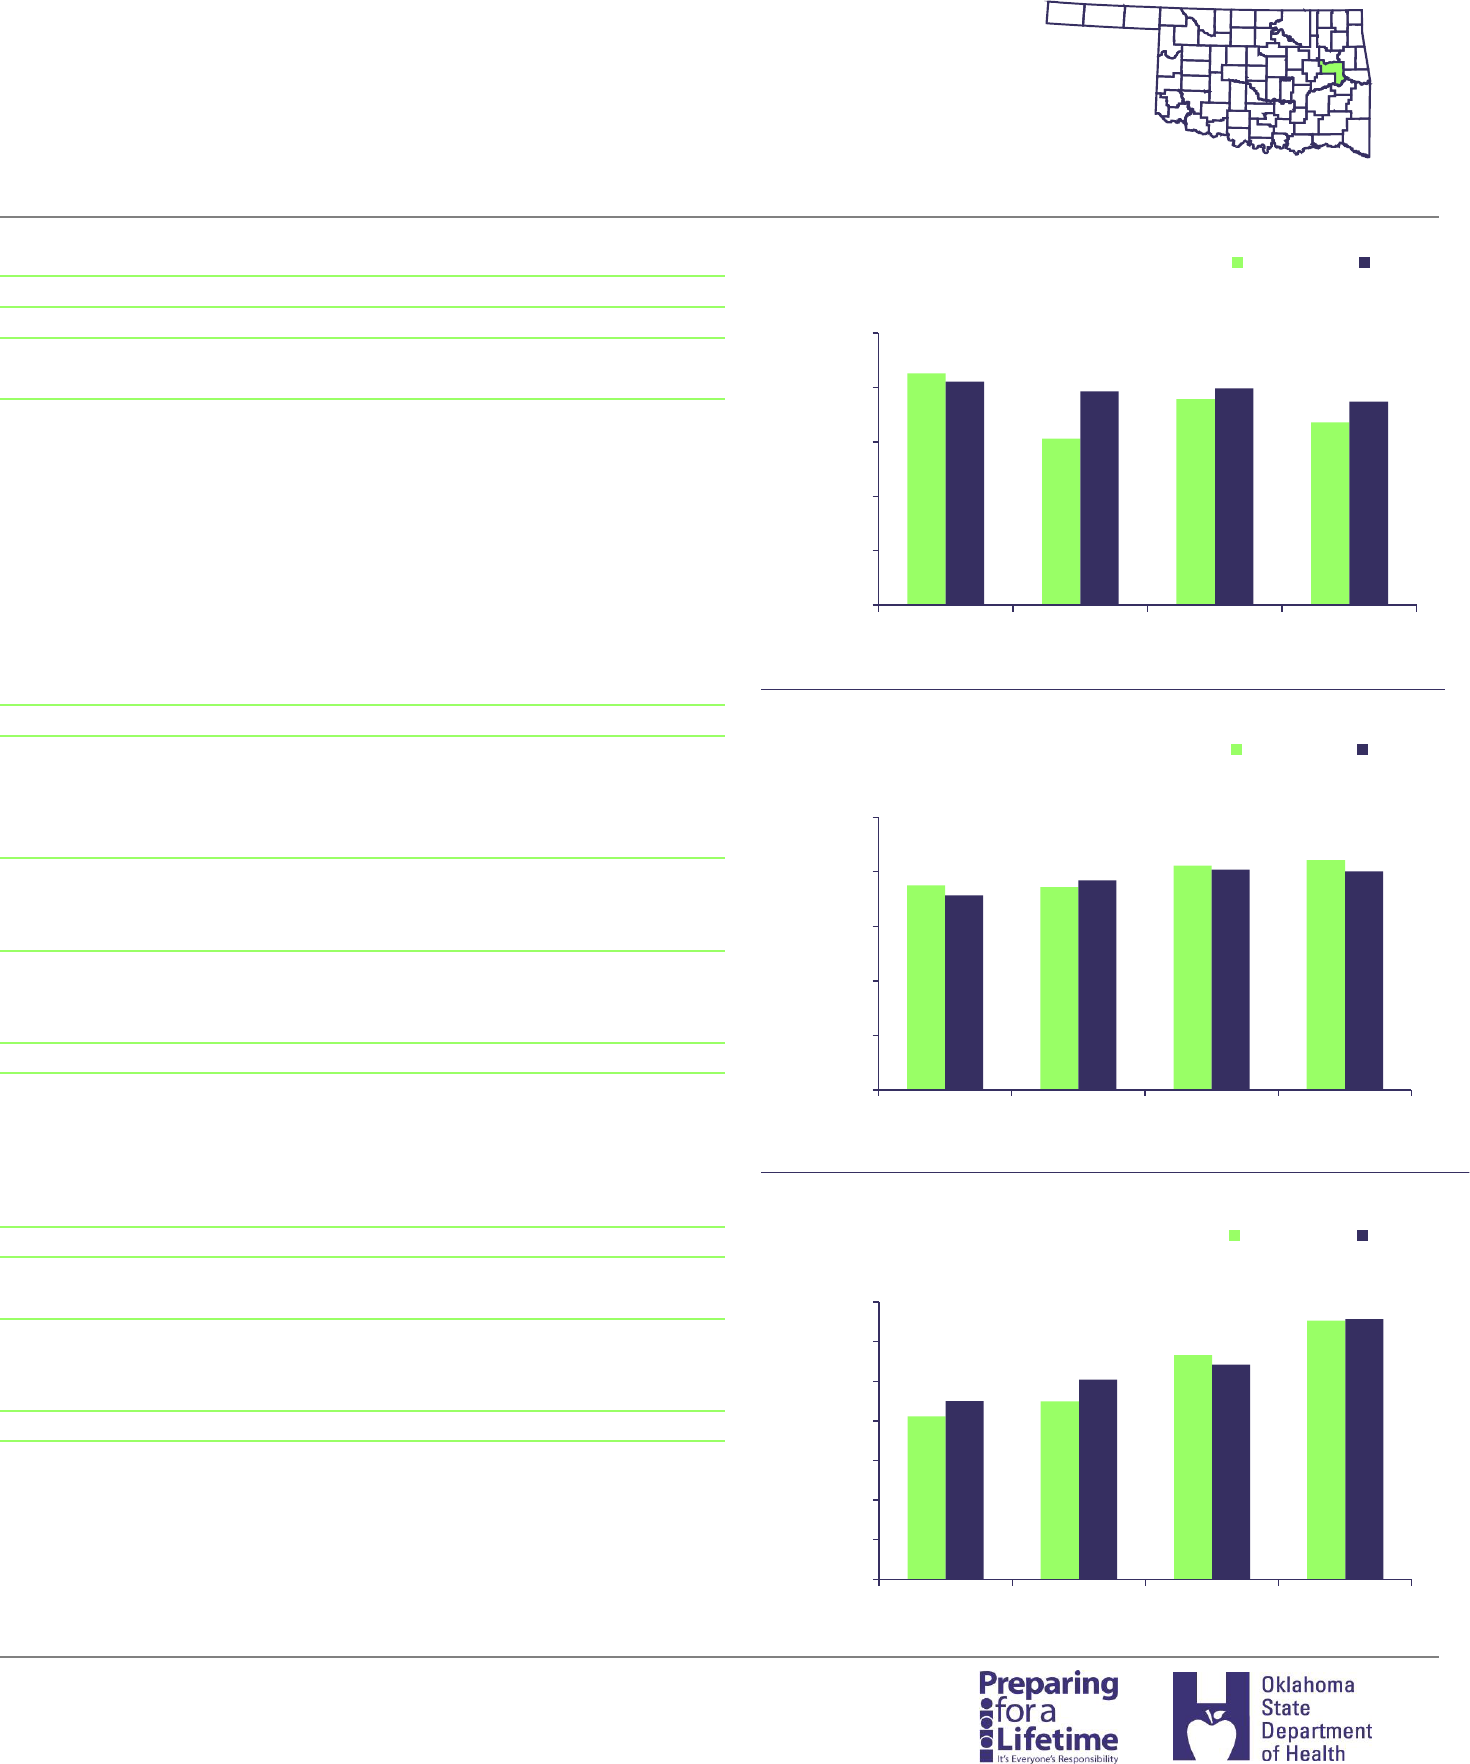
Oklahoma Live Births and Infant Deaths
Muskogee County
8.5
6.1
7.6
6.7
8.2
7.9
8.0
7.5
2.0
4.0
6.0
8.0
10.0
1995-1999 2000-2004 2005-2009 2010-2014
Rate per 1000 live births
Infant Mortality Rate
Infant deaths per 1000 live births
Muskogee State
7.5
7.4
8.2
8.4
7.1
7.7
8.1
8.0
0.0
2.0
4.0
6.0
8.0
10.0
1995-1999 2000-2004 2005-2009 2010-2014
Percent
Percent of Low Birth Weight Births
(500-2499 grams)
Muskogee State
8.2
9.0
11.3
13.1
9.0
10.1
10.8
13.2
0.0
2.0
4.0
6.0
8.0
10.0
12.0
14.0
1995-1999 2000-2004 2005-2009 2010-2014
Percent
Percent of Preterm Births
(20-36 weeks)
Muskogee State

Technical Notes
Infant death= a live birth dying before day 365 or completing one year of life
Infant mortality rate = (number of deaths before day 365 / total number of live births) x 1000
Birth rate = 1000 x number of resident live births / resident population
Low birth rate = birth weight 500-2499 grams
Very low birth rate = birth weight 500-1499 grams
Gestational age data shown in this report are derived from the obstetric estimate of gestation
and date of last menses
Preterm births = 20-36 weeks gestation
Early term/late preterm births = 37-38 weeks gestation
Data Sources
1
2 Oklahoma State Department of Health, Health Care Information, Vital Records.
3
4
5
U.S. Census - American FactFinder
U.S. Census - Small Area Health Insurance Estimates
U.S. Census - Small Area Income and Poverty Estimates.
CDC Wonder, State Population Projections 2004-2030 Request.
